Professional options‑flow analytics, all in one place.
Gamma levels for every strike, live dealer positioning and a heatmap for QQQ and SPY, built for NQ and ES traders. See where price is likely to stall or speed up before it gets there.
Secure billing through Whop. Cancel anytime.
The levels do the work. Here's how often.
of trading days, price reacted off a gamma level for a move of 100+ NQ points.
of trading days, the high or low of the day formed at a key GEX level.
Measured across every trading day since May 2026.
And on 100% of those days, GexLevels showed where dealers were positioned. Most traders never see that.
Watch it work, every day.
Every trading day from October 1 to 16, built from actual market data for each date and shown the way it looked on GexLevels. The levels were on the screen before the open.
Track smart money.
Whether market makers are long or short gamma, and so whether their hedging will dampen the next move or chase it.
The strikes where the most gamma sits. They become the call and put walls price keeps reacting to.
Dealer delta and vanna by strike: the prices where their hedging has to buy or sell the underlying.
What the options market is pricing for today, this week and this month, drawn as high and low bands on the ladder.
Put together, it's the picture the desks on the other side of your trade are working from, live on your screen.
The desks on the other side of the trade
Everything in one tab.
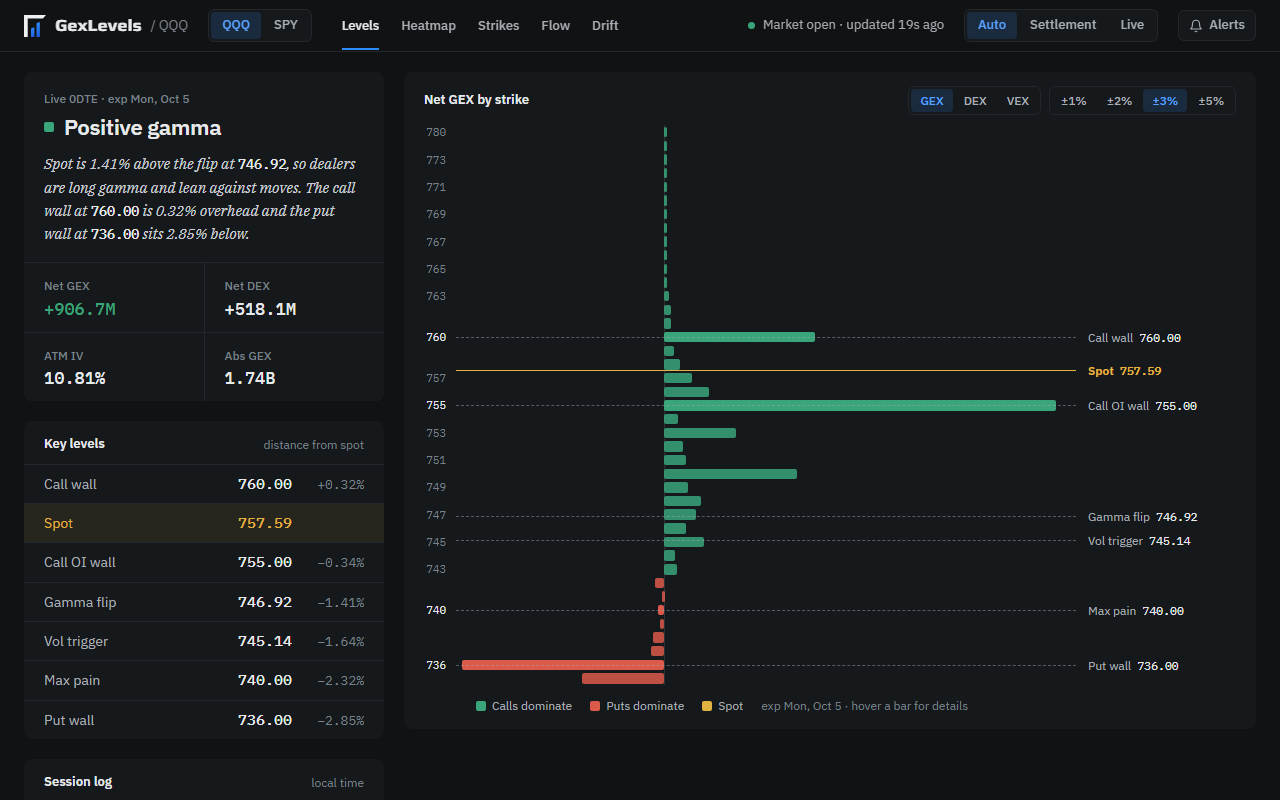
Gamma levels per strike
Call and put walls and the gamma flip on a price ladder that reads like your chart, with a plain-English read of what dealers are likely to do. Switch between 0DTE and all expiries, refreshed every minute.
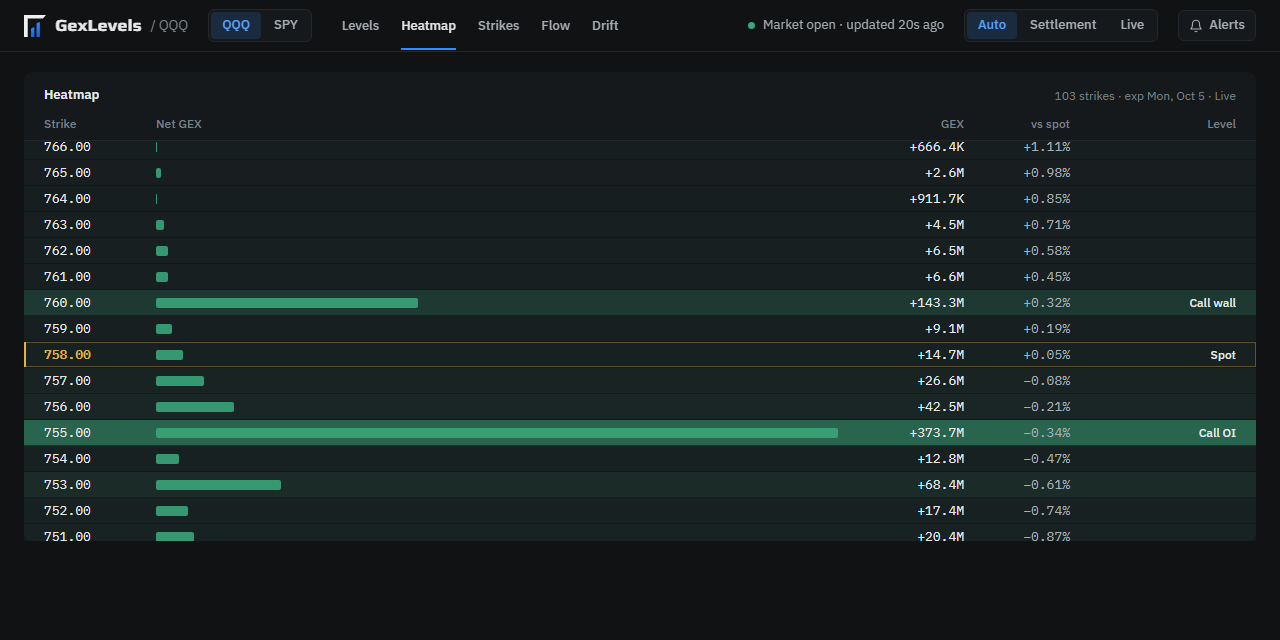
Heatmap
QQQ, NDX, SPY, SPX and IWM side by side, every strike tinted by how much gamma sits there, with the walls, spot and largest strike marked. Switch between GEX, DEX, VEX and charm.
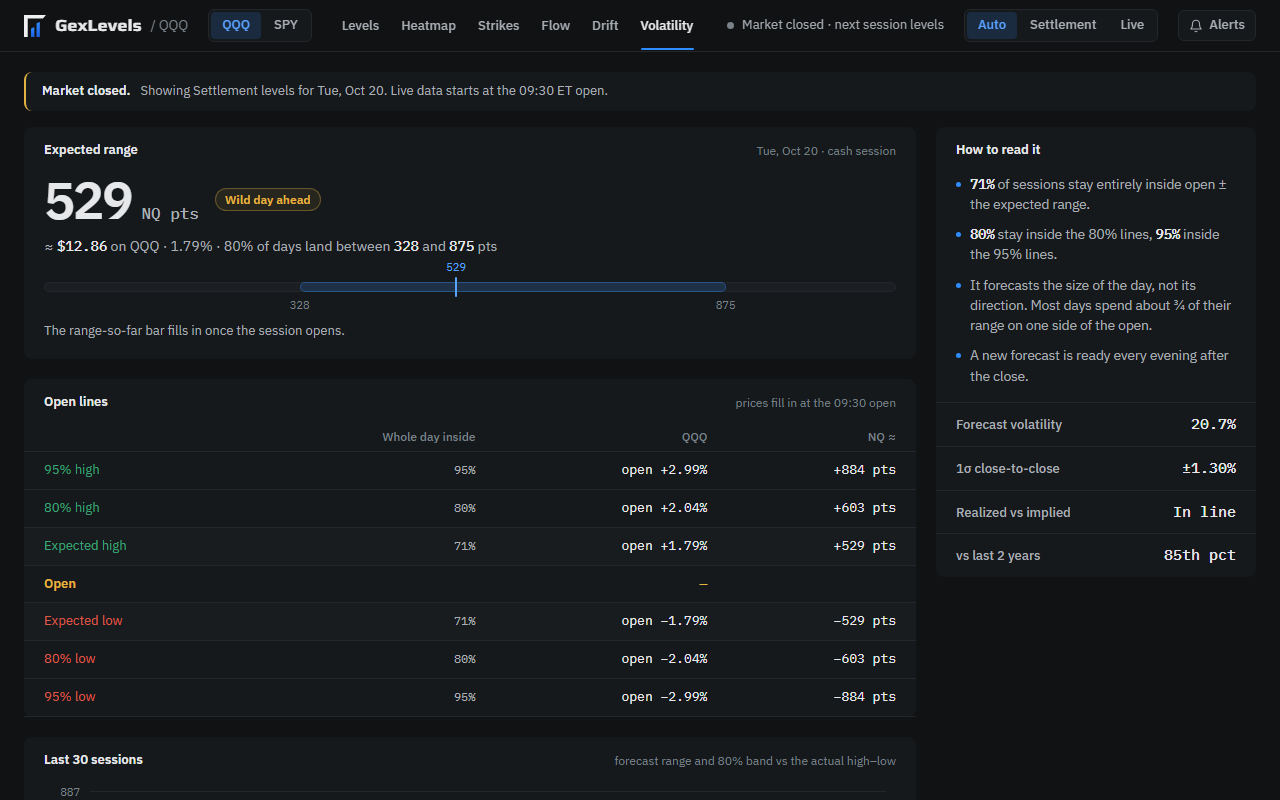
Volatility forecast
Tomorrow’s expected range for NQ and ES, ready the evening before. At the open it marks the lines the whole session stayed inside on 80% and 95% of days, measured on every session since 2001, and shows how much of the range is already used up.
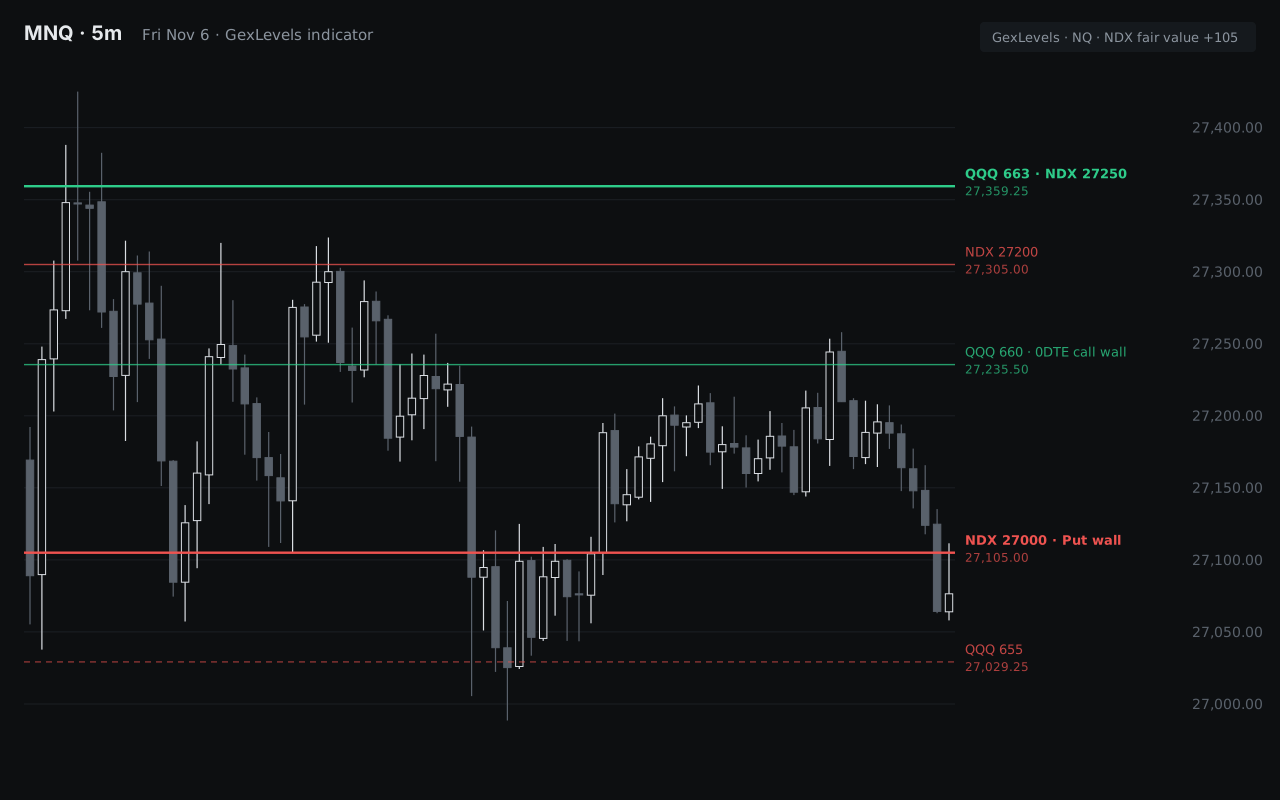
Levels on your TradingView chart
Today’s QQQ and NDX levels drawn straight onto your NQ or MNQ chart, converted to futures prices (SPY and SPX on ES and MES). Copy one code from the dashboard in the morning, paste it into the GexLevels indicator, and the walls, Max GEX and key strikes sit on the chart you already trade from.
DEX, VEX and charm
Dealer delta, vanna and charm by strike on the same ladder.
Alerts
Price and regime alerts when spot crosses a wall or the flip.
Community and journal
Daily premarket notes and Q&A in the private Discord, plus the Edgecrafter trading journal.
Professional tools. Retail pricing.
Here's what the same toolkit costs if you put it together yourself.
3 days free
then $977 €19 a month
- Gamma levels per strike for QQQ and SPY
- 0DTE and all-expiry views, refreshed every minute
- Heatmap, strike table, DEX, VEX and charm
- Implied moves and wall tracking through the session
- Volatility forecast: tomorrow’s expected range for NQ and ES
- TradingView indicator: the levels on your NQ and ES chart
- Price and regime alerts
- Private Discord with daily premarket notes and Q&A
- Edgecrafter trading journal
Checkout on Whop. Cancel before the 3 days are up and you won't be charged.
Fair questions.
What is GexLevels?
A dashboard that shows where options dealers are positioned in QQQ and SPY: how much gamma sits at each strike, where the walls and the gamma flip are, and how they shift through the session. Those are the prices where dealer hedging tends to slow a move down or speed it up.
Why is it so affordable?
We keep our costs low, and there's no sales or marketing team to fund. The goal is to make professional tools available to everyone, not to squeeze out as much money as possible.
Will it work with my strategy?
Yes. Gamma levels aren't a strategy of their own; they add context to whatever you already do. Many traders use them as targets, as places to tighten stops, or to decide whether a breakout is likely to run or fade.
Is it worth the money?
At €19 a month, one good trade typically covers the subscription many times over. The 3-day trial lets you check that against your own trading before you pay anything.
Does it work for NQ and ES futures?
Yes, that's who it's built for. QQQ tracks the Nasdaq 100 and SPY tracks the S&P 500, so a level on QQQ is the same level on NQ, just at a different price. To convert, multiply by the ratio between the two:
NQ level = QQQ level × (NQ price ÷ QQQ price)
ES level = SPY level × (ES price ÷ SPY price)
NQ trades at roughly 41× QQQ and ES at roughly 10× SPY. Take the ratio from the current prices when you mark your chart, since it drifts a little over time. Example: with the ratio at 41.2, a 730 call wall on QQQ is about 30,076 on NQ.
Which markets does it cover?
QQQ and SPY, which carry the deepest 0DTE options activity and map directly onto NQ and ES.
How fresh is the data?
During the session, levels refresh every minute. Outside the session you see the most recent snapshot, and after the close the 0DTE view moves on to the next expiry.
Does it give trade signals?
No. GexLevels is a map, not a signal service. It shows where the important prices are and what dealers are likely to do there; when and how to trade is your call.
How does it compare to other GEX tools?
Dedicated GEX dashboards typically cost $99 to $699 a month. GexLevels covers the levels, heatmap, implied moves and a volatility forecast in one place for €19, plus the community and journal. Some larger tools have more tickers or extra models; if you trade NQ and ES, the QQQ and SPY picture is what matters.
What's included in the membership?
The full dashboard, the private Discord with daily premarket notes and Q&A, and the Edgecrafter trading journal.
How do I cancel?
Through your Whop account, anytime. Cancel before the 3-day trial ends and you won't be charged.
Is this financial advice?
No. GexLevels is an analytics tool for education and research. Trading futures and options carries real risk of loss.
See tomorrow's levels tonight.
Start with 3 days free. Members log in with Whop.